

Hyunsang Cho

Case 012026Raymind.AI

Paldo SajuA checkout flow people trust before they pay

An AI consultation that uses saju to hear people's worries first. I designed, built and launched it on my own, and run it with around 30 AI agents. In the first three weeks I measured every step of the funnel and fixed the checkout screen with A/B tests. Removing a struck-through list price that had never been charged, and showing the real price, raised revenue per checkout visitor by 61%.

paldosaju.com↗
Role
Planning, UX and UI design, metric design, experiment decisions, development (Claude Code)
Period
Launched 12 October 2026, first three weeks
Platform
Mobile web. KakaoPay, Naver Pay and card, with no login
Team
Built solo, with around 30 AI agents sharing the operations
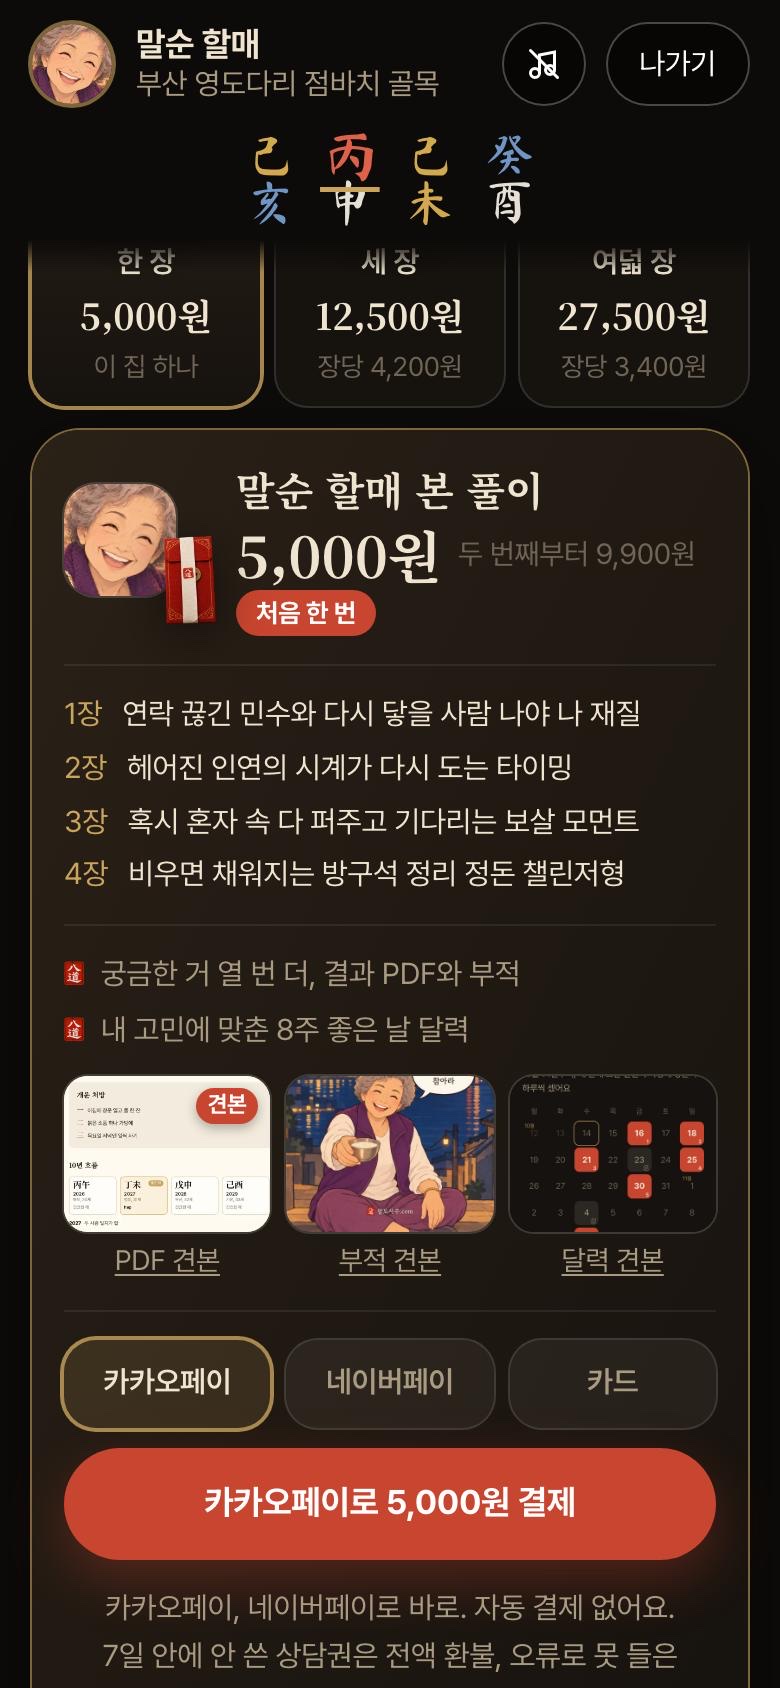
Paldo Saju first screen, with Grandma Malsun Paldo Saju checkout screen

About the project

Paldo Saju is not a fortune-telling app. It is a consultation that hears people's worries first. Saju is the Korean four pillars reading, and I believed that starting from a topic this narrow would let it hear worries in detail and answer them precisely. AI characters styled as saju masters from Korea's eight provinces (the paldo in the name) hear the user's story first, then talk them through the saju drawn from their date of birth.

I am building it on my own. I do the planning, screen design and metric design myself, and around 30 AI agents share the operations, each with its own role. Agents for priorities, deployment, finance, data, the funnel, pricing and ads each work within set permissions, and every change goes into the change log. I designed the roles, permissions and decision criteria first, so a one-person team could run like a large organisation.

What I decide
Prices, new paid channels, budget increases
What the agents do
Screen changes, experiment allocation, result calculations and ad operations. Only within a daily ad cap, a loss cap and a limit on budget changes
Screens where money is at stake
I sign off every payment screen from phone captures before it changes
Records
Every change and experiment in the change log, summed up on one page every Monday
AI cost
Prompt caching on the free-reading LLM calls cut the cost per call by 19.5%
Launch
12 October 2026, mobile web
The user problem I set out to solve
Even after hearing the free reading to the end, 87% of users who saw the checkout screen pressed nothing. Before paying, they had no way to know whether the reading was worth the money or whether the price was honest.
Why it mattered
Acquiring a user through ads cost two to three times the revenue that user brought in. Unless the checkout flow was fixed, the more users I brought in, the bigger the loss.
How I went about it, and what I chose
I used a metric tree and the funnel to find the step that leaked most, set the primary metric and guardrails first, then A/B tested the checkout screen one change at a time. When design opinions split, user behaviour made the call, not taste.
Results and what I learned
Removing the struck-through list price and showing the real price raised revenue per checkout visitor by 61%. The business has not reached break-even yet, and that gap taught me five things.
+61%Revenue per checkout visitor
after removing the fake list price
9.2%Conversion after showing two lines
of the reading for an email (5.8% before)
22%Share of new visits not from ads
(12% in week two)
00Product

One worry and a date of birth, and a master talks it through with you.

Saju is full of difficult terms and dense information. Paldo Saju keeps the saju chart small at the top, and the master talks it through in conversation, shaped around the worry the user picked. The structure starts from the user's question and brings out only as much of the complex information as they need. The free reading leads to the reading's contents page and then to the checkout screen, and users pay straight away, with no app to install and no login.

First screen
First screenPick a master and say what is on your mind
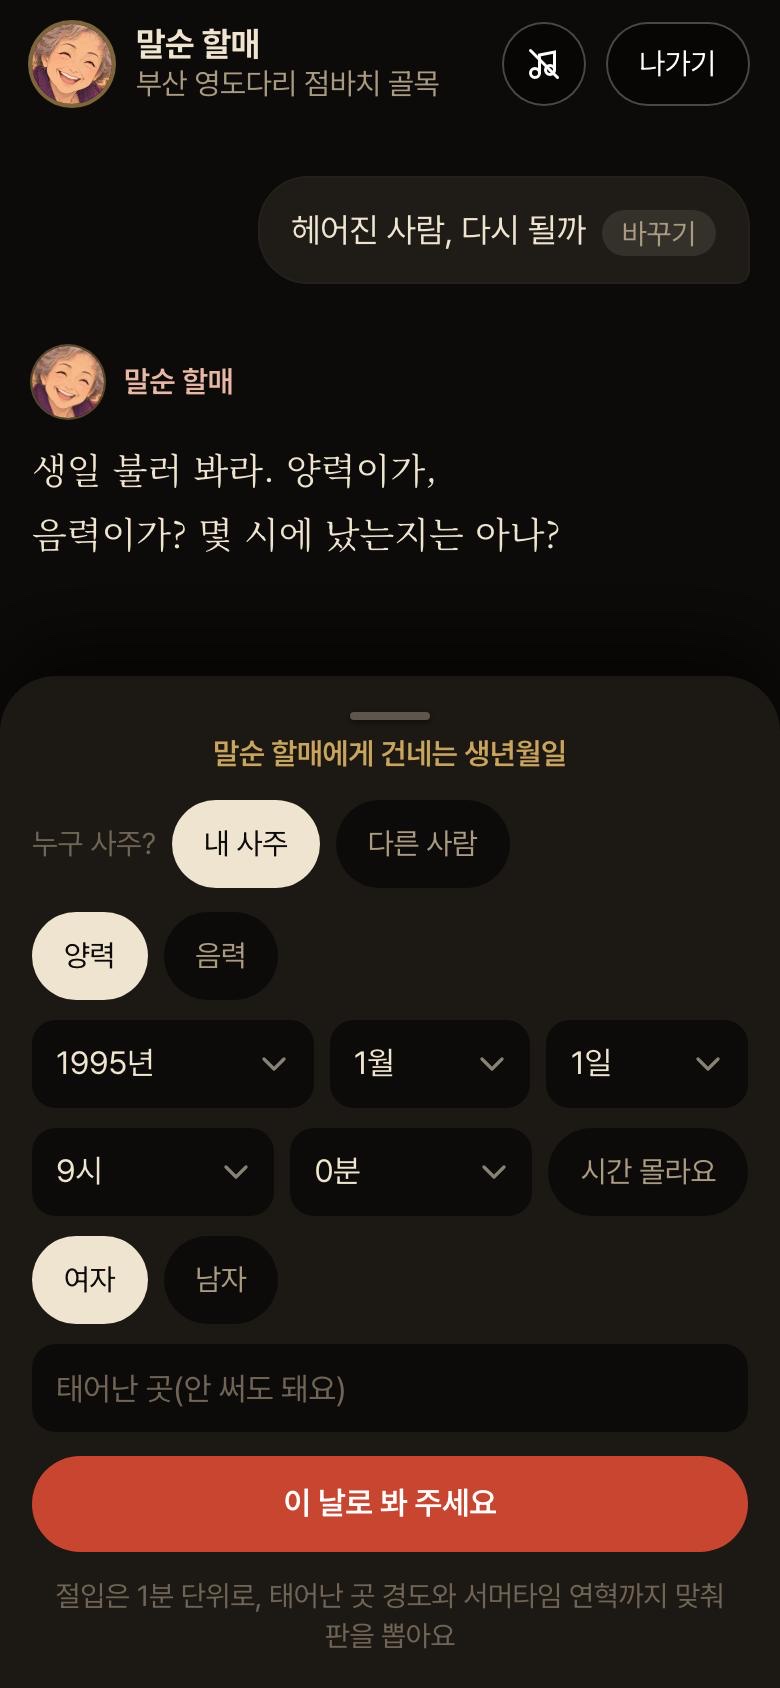
Date-of-birth entry
Date of birthOnly a date of birth, no login
Free reading
Free readingThe chart sits on top, the reading comes as conversation
Reading contents
Reading contentsShows where the answers are, then locks them
Checkout screen
Checkout screenWhat you get and what it costs, on one screen

Screens are in Korean.

01The user problem I set out to solve

Users heard the free reading to the end, then stopped at the checkout screen.

A saju reading is a product you cannot check before you buy. Until they pay, users cannot know whether the reading is worth the money or whether the price is honest. That hesitation turned straight into drop-off.

Users from ads, daily average from 24 to 30 October. Bars show each step's share with the first screen as 100. Numbers show the rate carried over from the step before. From the first screen to completed payment, it was 2.7%.

87%

Share of users who saw the checkout screen and left without pressing anything. Every other step kept 57 to 92% of the step before. Here, only 13% carried on.

74%

Of users who entered a date of birth but never reached the checkout screen, the share who left within 34 seconds of seeing the contents and the first price. The moment they saw the price was the turning point.

34%

Share who started a consultation and left before the first answer appeared. 48% of them left within 5 seconds.

74% and 34% are new users from Meta ads, 18 to 31 October.

02Why the problem mattered

Unless this step was fixed, every extra user brought in would only deepen the loss.

It was the biggest leak

At every other step of the funnel, more than half the users from the step before carried on. Checkout button click-through was only 13%. For the same effort, this was the spot that could move most.

Ads could not fill the gap

Acquiring a user through ads cost two to three times the revenue that user brought in. Spending more on ads with the checkout flow unchanged would grow the loss faster than the revenue.

Where money changes hands, trust comes first

The less a user can see of a product before buying, the more they look for honesty in the price and the tone. I judged that a price dressed up as a discount, or words that rush people to pay, might lift clicks today but would wear trust down. Every screen where money changes hands has the same problem.

October revenue against ad spendRevenue divided by ad spend. Break-even is the line where revenue, after payment fees and costs such as AI, covers the ad spend.
Actual67%
Break-even148%

So the order was set: fix the checkout flow before spending more on ads. On 22 October I cut the ads instead.

03How I went about it, and what I chose

I decided what to watch first, and wrote it down before changing anything.

Each week I compared the four boxes with the week before and pushed first on the one that could move most. The box I pushed on is the bold one, conversion rate, and within it the checkout button click.

Choice 1

One primary metric: revenue per checkout visitor

Watch conversion alone and you can win by selling cheap. Watch order value alone and you can win by selling less. I made the call on one number that holds both.

Choice 2

Guardrails: conversion rate and confirmed contacts

Even if the primary metric rises, a test is switched off when a guardrail falls further than its set margin. It is the line that stops me losing users while chasing revenue.

Choice 3

Write it down before switching on, review it every week

Before switching a test on, I wrote the hypothesis, the numbers to watch, the decision date and the stop criteria in the change log. Every Monday I grouped the week into what changed, what happened, what I learned and what comes next.

Choice 4

With small samples, roll out only when every signal agrees

For a small service, statistical certainty took weeks. I rolled a change out to everyone only when the primary metric and the guardrails all pointed the same way, and kept watching after that.

Choice 5

People decide, AI agents run

I decided prices, new paid channels and budget increases. AI agents handled screen changes, experiment allocation and result calculations, logging each one in the change log. Screens where money is at stake I approved from captures before they changed.

Designing the checkout screen

Paldo Saju checkout screen
  1. What you get, firstInstead of a product description, the titles of the four chapters this user will get. Users know what they will get before they see the price. This order is now a design system rule, reused on the checkout of other products.
  2. Prices as they areThe first-time price and the price from the second time on sit side by side. No list price that has never actually been charged.
  3. Payment methods at equal sizeKakaoPay, Naver Pay and card sit side by side at the same size. Payment goes straight through, with no login.
  4. Promises right under the buttonOne line under the checkout button covers refunds for unused consultation passes and refunds for errors.

A/B tests on the checkout screen

Removing the struck-through list price

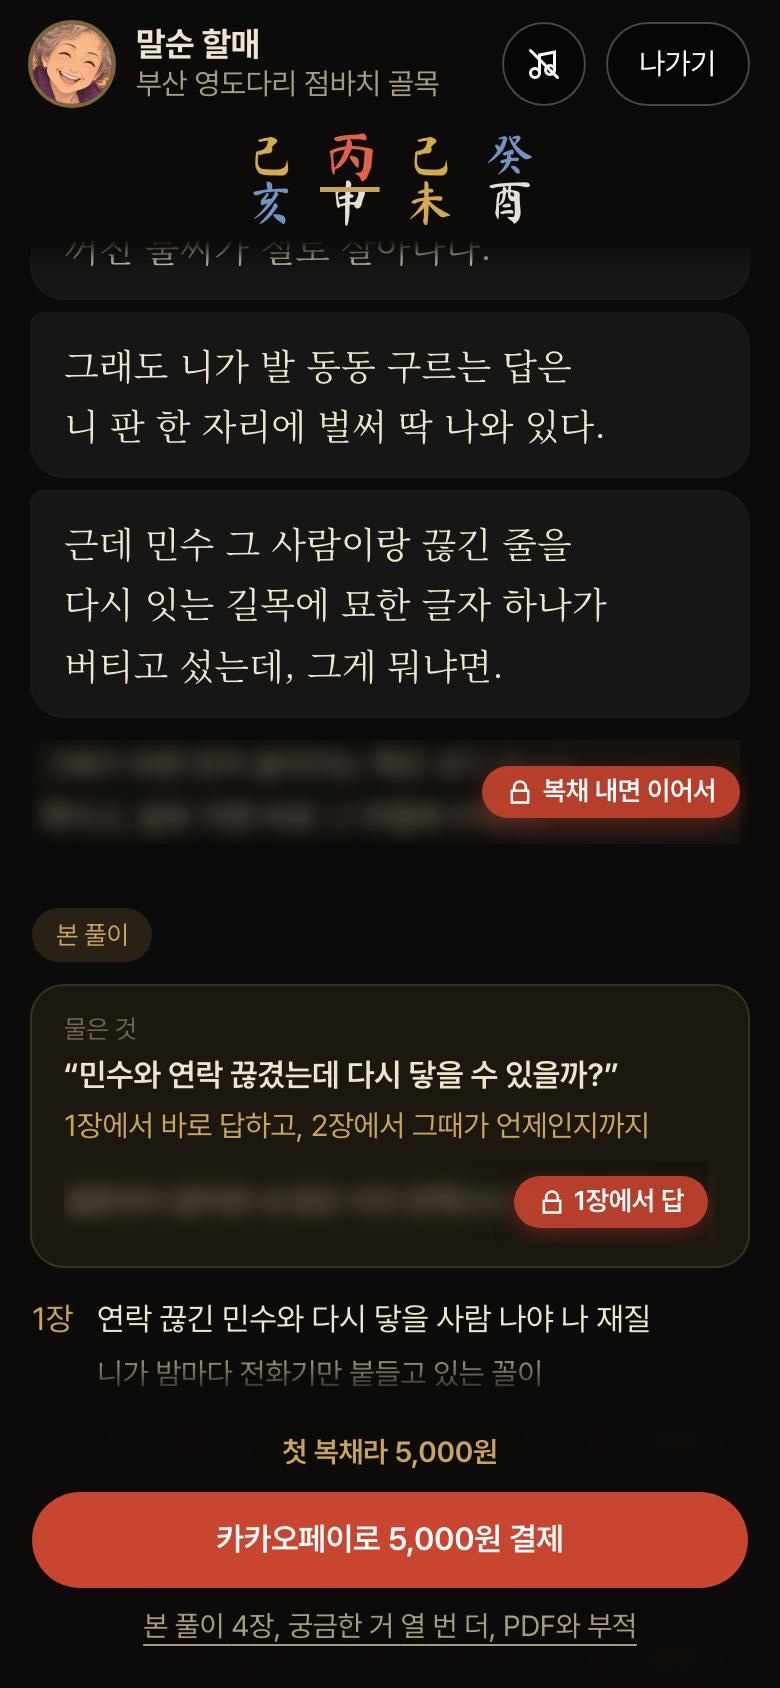
I realised the half-price display I had put in at launch was based on a list price that had never actually been charged. Rather than delete it outright, I tested it side by side with a version that showed the first-time price and the price from the second time on, as they really were. The hypothesis was "showing the real price will not sell less".

BeforeBefore: a struck-through list price and a half-price badge on the first reading fee AfterAfter: the first-time price and the price from the second time on

+61%Revenue per checkout visitor
17.8%Checkout button click-through
(15.6% before)

Clicks rose only a little, but 46% more people completed payment, and each paid slightly more, which adds up to 61%. Both sides charged exactly the same price; only the display differed. The call was made early, before the planned seven days, once each side had passed 150 people.

Decision: rolled out the new version to everyone and made it the price display rule.
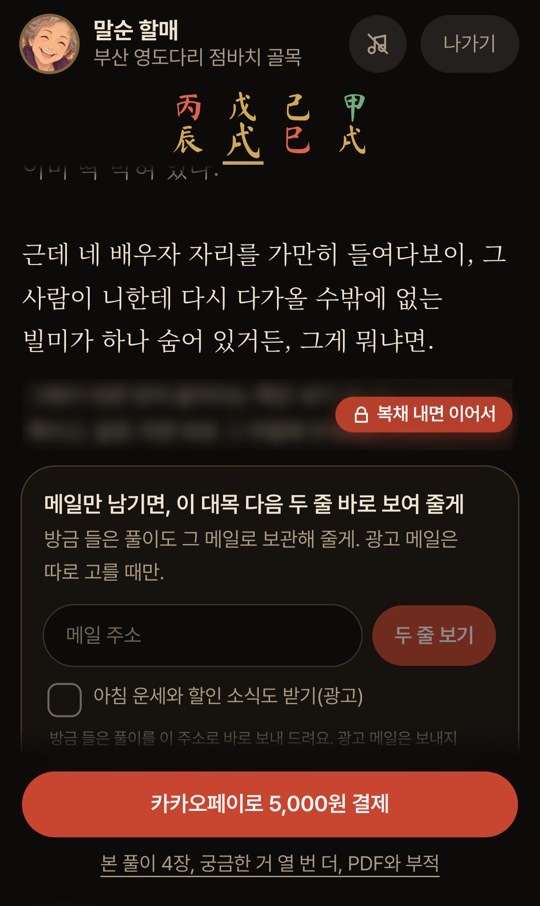
Give before you ask

Two blurred lines at the end of the last free answer, with an email field

I cut the last free answer at the point users most wanted to read on, and showed the next two lines of the reading as soon as they left an email address. Rather than pushing for payment, it gave users one more reason to keep going.

9.2%Conversion (5.8% before)
+40%Payments per user

Decision: the sample was too small for statistical certainty, but payments per user, conversion and confirmed contacts all pointed the same way, so I rolled it out to everyone.

When design opinions split, user behaviour made the call

Is a faster first screen always better?

Users arriving from ads see only Grandma Malsun's portrait for the first few seconds, and meet the date-of-birth field only after she speaks to them. A draft proposed showing the form straight away, so more people would carry on. By the usual rule of removing friction, it was the right call.

78.7% → 67.6%Share who went on to enter a date of birth, after the draft went live
87.5% → 88.3%Visitors from the list, who never saw the draft, held steady

Decision: reverted that night. Before typing a date of birth, people first decide whether this is someone they can open up to. The few seconds in which the grandma speaks first were not friction but the time in which trust builds. This was a same-day before-and-after comparison, of about 280 people before and 220 after, so a narrower re-test is checking it again.

Now: only the portrait for the first few seconds
Now, the first secondsOnly the portrait; the field opens after she speaks
Draft: her words and the date-of-birth field from the start
Draft, from the startWords and form at onceReverted

One recommended card at the top of the list

After picking a worry, users see a list of masters who are good with it. I tested adding one card at the top, for the top master, with a single "First reading free" button, randomised by device, with about 400 people on each side.

66.6% → 76.9%Share who went on to enter a date of birth, a statistically significant gain
+20%Revenue per visitor, not yet significant

Decision: the earlier step clearly improved and revenue pointed the same way, so it went to everyone. But an earlier step alone never makes the call. From the same ad, the direct link and the list link split sharply on date-of-birth entry, 78.8% against 47.3%, yet revenue per arrival over a day was about the same. So I judge by revenue per person who arrives, not by clicks.

A: the list of masters only
A, list onlyThe list starts at the first card
B: a card for the top master with a First reading free button at the top
B, a card on topOne button to startRolled out
04Results

The checkout screen got better, but the business has not yet reached break-even.

Checkout flow A/B tests, first three weeks after launch

What changedResultDecision
Removed the struck-through list price and showed the real priceCheckout click-through 15.6% → 17.8%
Revenue per checkout visitor +61%
Rolled out
Leave an email to see the next two lines of the reading firstConversion 5.8% → 9.2%
Payments per user +40%
Rolled out
When users go back from checkout, a sheet that saves the reading they just heard by emailConversion 11.9% → 13.5%
Payments per user +19%
Rolled out
Reordered the worries on the first screenRevenue per checkout visitor +48%Rolled out
Kept the post-payment add-on offer open for 24 hours instead of 20 minutesAdd-ons within 24 hours 15.8% → 20.0%
Net revenue per user +8.7%
Kept 24 hours
Added one line to the contents: the answer is already in your chartClick-through 20.6% → 22.0%,
not significant
Kept (neutral result)
Made a bundle of three readings the default first purchase+78% per user in the A/B test
Click-through halved after rollout
Reverted
A higher-priced product card at the top of checkoutRevenue per checkout visitor -72%, same day as a price test
The cause could not be isolated
Reverted

The business as a whole

+87%

Revenue in the second week after launch, up 87% on the first week.

67%

October revenue against ad spend. Break-even was 148%, and the contribution margin was -83% of revenue.

-76%

After cutting ads on 22 October, the daily loss fell by 76%. Daily revenue fell by 65% as well.

-56%

Weekly revenue in week three. With fewer ads, new visits fell by 31%, and conversion slipped from 5.8% to 4.0%. The biggest factor was checkout button click-through dropping from 12% to 9%.

22%

Share of new visits in week three that did not come from ads (organic search, owned channels). In week two it was 12%.

05What I learned

Five lessons from the first three weeks

  1. 01

    Where money changes hands, the truth converts

    The checkout used to show a struck-through list price that had never actually been charged. When I removed it and showed the real price, revenue per checkout visitor rose by 61%. Since then, "a price that has never actually been charged is never used as a comparison price" has been the price display rule.

  2. 02

    A winning screen is not a winning business

    Most of the checkout A/B tests won, but October revenue against ad spend was 67%, short of the 148% break-even. I cut the ads, which brought the daily loss down by 76%, and changed the order so the funnel gets fixed first.

  3. 03

    A win on a small sample gets checked again after rollout

    The bundle of three as the default led by 78% per user in the A/B test, but once it went out to everyone, checkout button click-through halved, so I reverted it. In week three, checkout button click-through fell from 12% to 9%. A screen that won can lose again when the users change.

  4. 04

    One test per surface at a time, with the criteria set before it starts

    On the same day I switched on a price test and a higher-priced product card on the checkout screen. Revenue per checkout visitor fell by 72%, and I could not tell which one caused it. Since then, any surface where money is at stake runs a single experiment, and other changes wait until the call is made.

  5. 05

    Give before you ask

    Instead of asking for an email first, I offered the next two lines of the reading right after the point users most wanted to read on, and conversion rose from 5.8% to 9.2%. The step that collects contact details helped payment instead of blocking it.